

Treatment Plan Presentation Statistics Report
Find metrics by user regarding Treatment Plan Presentation by running the Treatment Plan Presentation Statistics report.
In Standard Reports, in the Monthly section, click Treatment Presentation Statistics.
This report shows various metrics about saved treatment plans, by treatment plan presenter, including:
- Total number of treatment plans saved in a date range.
- Total number of procedures in the saved treatment plans.
- Total number of procedures that currently have a status of scheduled or completed.
- Gross and net totals for presented plans and procedures.
- To assign presenters to treatment plans, see Edit Treatment Plan.
- To control user access to this report, see Report Setup: Security Permissions.
Filters
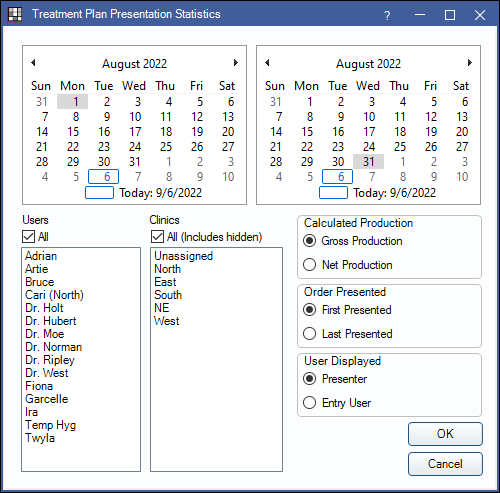
Set report filters before running the report.
Calendars: Select the date range for the report. Only treatment plans saved within the date range will be included. The default is last month.
- Select the start date in the left calendar.
- Select the end date in the right calendar.
Users: Select the users (or presenters) to include in the report. Ctrl + click to select multiple users. Check All to include all users, including those marked Is Hidden.
Clinics: Select clinics to include in the report. Ctrl + click to select multiple clinics or check All (includes hidden) to include all clinics, including those marked hidden.
- Filters by clinic assigned to procedure.
- If user is restricted to specific clinics, only accessible clinics will list.
Calculated Production: Select an option to determine how production is calculated when running report. The selected option will also determine the available columns on the generated report. See Report Preview below for more information.
- Gross Production: Select to run report calculating by gross production only.
- Net Production: Select to run report by calculates net production (gross production - estimated or actual write-offs - discounts - adjustments).
Order Presented: Production for procedures on multiple treatment plans will only be counted once. Select to whom production for these procedures should be attributed.
- First Presented: Attribute production to the user or presenter on the treatment plan saved first.
- Last Presented: Attribute production to the user or presenter on the treatment plan saved last.
User Displayed: Select how the report presenter will be determined.
- Presenter: The presenter associated with the treatment plan.
- Entry User: The user entry associated with the treatment plan.
Report Preview
After setting the report criteria, click OK to generate a print preview of the report. Below are examples of the two report types and the report columns.
For a description of toolbar buttons, see Complex Report System.
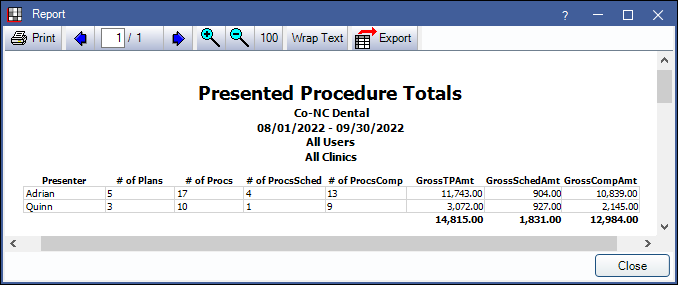
Gross Production Example
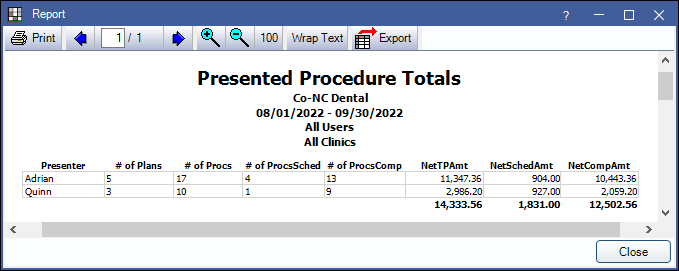
Net Production Example
- Presenter: The treatment plan presenter. Determined by the selections on the prior report window.
- # of Plans: The number of treatment plans saved in the date range by the user.
- # of Procs: The total number of treatment planned procedures in saved treatment plans. Excludes deleted procedures that are still listed in a saved treatment plan.
- # of ProcsSched: The total number of treatment planned procedures in saved treatment plans that are attached to an appointment with a status of scheduled and were created in the date range. The appointment date must also be in the report date range.
- # of ProcsComp: The total number of procedures completed from saved treatment plans that were created in the date range.
- The following columns only appear when Gross Production is selected:
- GrossTPAmt: The total gross amount for all treatment planned procedures in saved treatment plans created in the date range. Excludes deleted procedures that are still listed in a saved treatment plan.
- GrossSchedAmt: The total gross amount for all treatment planned procedures in saved treatment plans created in the date range, that are attached to an appointment with a status of scheduled.
- GrossCompAmt: The total gross amount for all completed procedures in saved treatment plans created in the date range.
- The following columns appear when Net Production is selected:
- NetTPAmt: The total net amount for all treatment planned procedures in saved treatment plans created in the date range. Excludes deleted procedures that are still listed in a saved treatment plan.
- NetSchedAmt: The total net amount for all treatment planned procedures in saved treatment plans created in the date range, that are attached to an appointment with a status of scheduled.
- NetCompAmt: The total net amount for all completed procedures in saved treatment plans created in the date range.